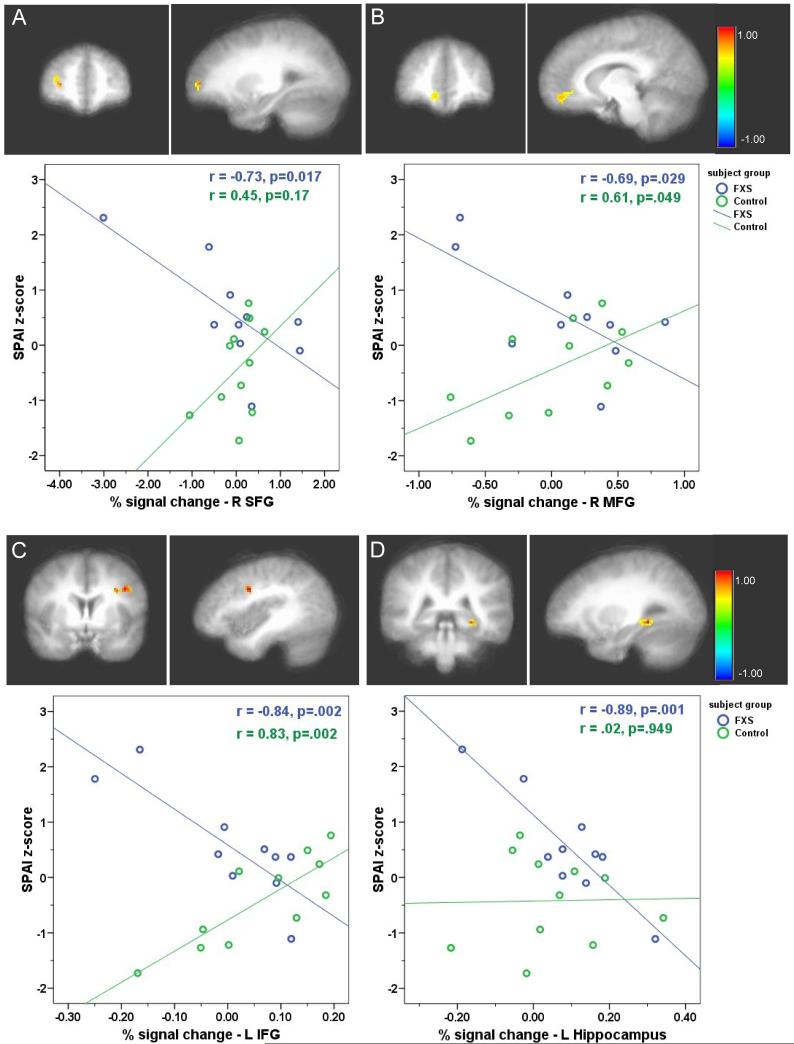
Figure 5.
Regions of interest in the regression of SPAI z-score on brain activation in response to successfully remembered faces in the FXS and control groups (after accounting for variance associated with age and IQ). A: Right Superior Frontal gyrus (25,51,6), B: Right Medial Frontal gyrus (11,47,-8), C: Left Inferior Frontal gyrus (-39,1,32), D: Left Hippocampus (-27,-39,-2) (images presented according to radiological convention, in which the right hemisphere is depicted on the left side of the coronal image). Scatterplots of the correlations between SPAI z-score and percent signal change in each region are shown below.

