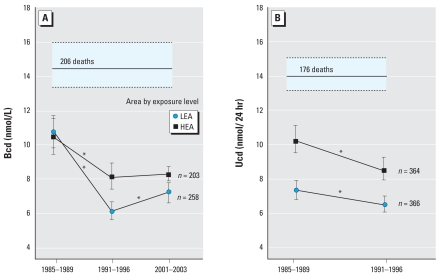
Figure 3.
BCd (A) and UCd (B) in the cohort analysis. The horizontal bar (deaths) indicates the geometric mean (solid line) with 95% CI (dashed lines) of the internal dose in subjects who died before 30 September 2007 (significance of the difference with survivors, p < 0.0001).
*Significant difference between consecutive measurements.

