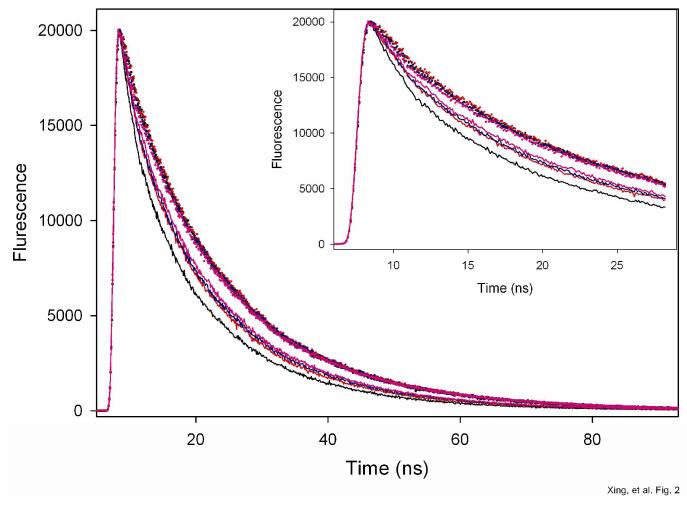
Figure 2.
Fluorescence intensity decays of AEDANS (donor) attached to residue 167 of cTnI in reconstituted cardiac thin filaments. Dotted curves, donor-only sample, solid curve, donor-acceptor sample in which actin was labeled with acceptor DABM at C374. Black, no Ca2+ (Mg2+ only); red, Ca2+ (+ Mg2+); Pink, myosin S1 is strongly bound to the filaments and in the absence of Ca2+, and blue, myosin is strongly bound to the filaments and in the presence of Ca2+. The decays were measured with excitation at 343 nm, and the emission collected at 500 nm. Sample were in 50 mM Mops at pH 7.0, 1mM DTT, 1 mM EGTA, 5 mM MgCl2, 0.2 M KCl. When Ca2+ was present, it was 2 mM CaCl2. The initial fast decays of these tracings are shown in the inset.

