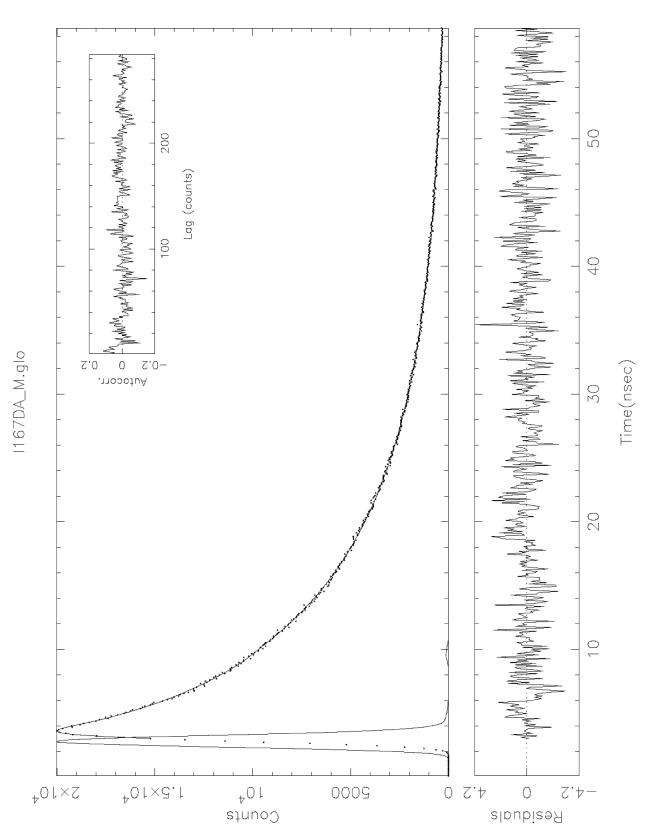
Figure 3.
An analysis of energy transfer from AEDANS attached to cTnI(167C) to DABM attached to actin(C374) in reconstituted cardiac thin filaments. The analysis shown here is for the corresponding decay curve shown in Fig. 2. The sharp peak on the left is the excitation light pulse. The donor intensity decay in the presence of acceptor (broad peak on the right) was fit to eq. 2 with a single Gaussian as P(r) and a sum of two exponential terms for IDA(r,t) (eq. 1). The residual plot of the fit is displayed in the lower panel across the figure, and the autocorrelation plot is shown as an inset at the upper right-hand corner. The best-fit data from this analysis were used to calculate the distribution of the inter-site distances between cTnI C167 and actin C374.

