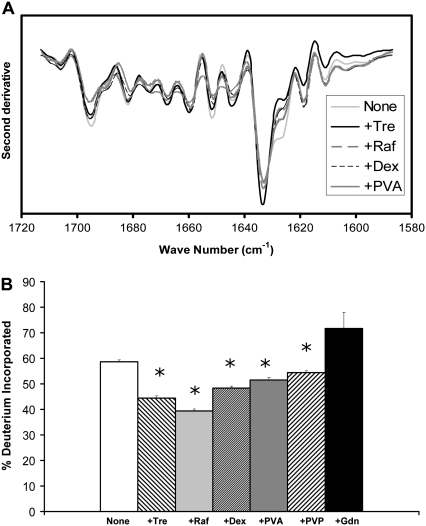
FIGURE 6.
Con A conformation in amorphous solids containing various additives (1:1 w/w). (A) Second derivative FTIR spectra. (B) ssHDX of intact protein. Additives were Tre, Raf, dex, PVA, PVP, and Gdn. In B, asterisk indicates significant difference from the value for the “None” sample (α = 0.05); n = 3 ± SD.

