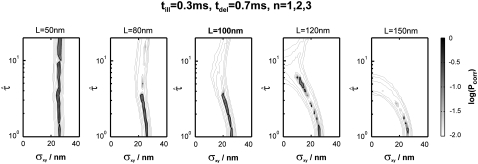
FIGURE 10.
Test results for data from experiments described in Wieser et al. (25). We included 262 trajectories in the analysis (mean trajectory length 8). Data were recorded at tlag = 0.7 ms, till = 0.3 ms. Probe data sets Y were simulated in a parameter range  L = 50–150 nm, and σxy = 0–40 nm, with a size of 5240 trajectories (mean trajectory length 8). To facilitate analysis, we fixed the macroscopic mobility at the value derived from msd analysis Dmacro = 0.47 μm2/s. The plots show the decadic logarithm of the corrected p-values as a function of D and σxy. Display settings are identical to those of Fig. 4. See main text for discussion.

