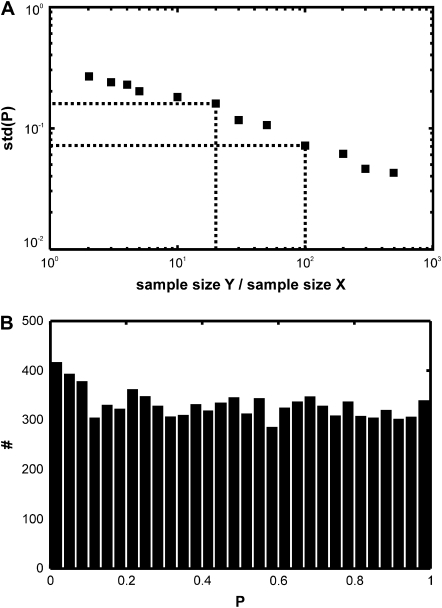
FIGURE 3.
Characterization of the p-value distribution. For the test data set X, we simulated trajectories with exponentially distributed length (mean 10 observations) and selected a subset of 200 trajectories with more than 5 observations for analysis. Both X and the probe data set Y were simulated at the same parameter settings D0 = 0.3 μm2/s, σxy,0 = 20 nm, till = 0 ms, tdel = 1 ms, n = 1. A shows the dependence of p-value variations on the probe sample size. For this, 1 sample X was tested against 50 different samples Y of a particular size, and the standard deviation of the resulting p-value is plotted as a function of the sample size ratio. (B) The distribution of p-values is uniform on the interval [0,1]. We tested 10,000 samples X against probe samples simulated at the same set point with a 100-fold larger sample size.

