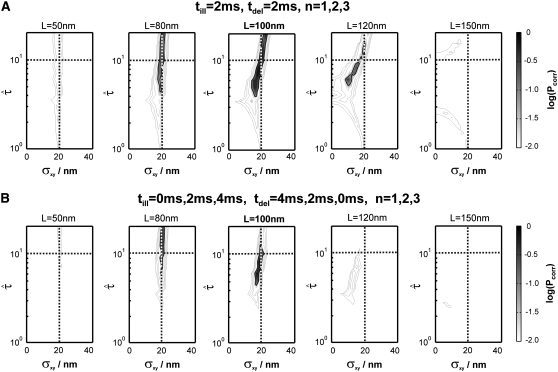
FIGURE 8.
Test results for a hop diffusion data set including effects of diffusion during illumination. We simulated trajectories with exponentially distributed length (mean 10 observations) and selected a subset of 500 trajectories with more than 5 observations for analysis. The set point for X was at the parameter settings L0 = 100 nm,  Dmacro = 0.3 μm2/s, and σxy,0 = 20 nm. Probe data sets Y were simulated in a parameter range
  L = 50–150 nm, and σxy = 0–40 nm, with a size of 10,000 trajectories. The plots show the decadic logarithm of the corrected p-values as a function of D and σxy. Display settings are identical to those of Fig. 4. A shows results for tdel = 2 ms and till = 2 ms including data for n = 1, 2, and 3. For this setting, the set point can be well extracted. When combining data sets simulated at (till = 0 ms, tdel = 4 ms), (till = 2 ms, tdel = 2 ms), and (till = 4 ms, tdel = 0 ms), the significance region can be further reduced (B).

