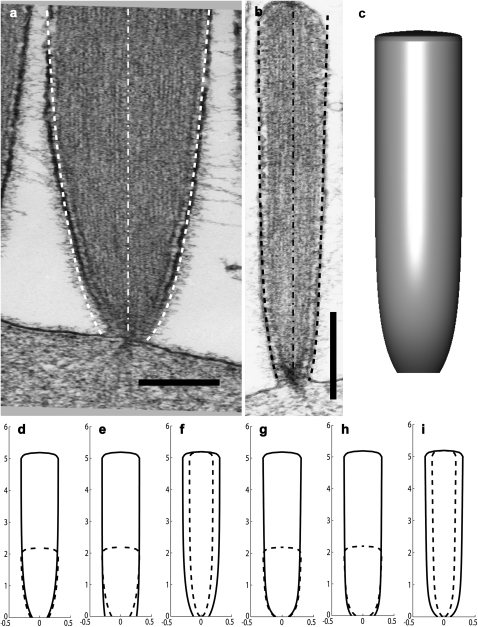
FIGURE 3.
(a and b) EM pictures of two stereocilia from a frog saccular hair cell, with the calculated profiles superimposed: right dashed line gives the solution for localization of DPs due to actin treadmilling, while the left dashed line gives the solution for localization of DPs due to myosin-VI. The dot-dashed lines show the axis of the stereocilia. The scale bar in panels a and b is 200 nm and 2 μm, respectively. (c) A three-dimensional illustration of the calculated stereocilia profile of panel b using the fit using actin treadmilling localization. In panels d–i, we plot some illustrations of the stereocilia shape change due to different height, polymerization rate, and number of filaments for both actin-treadmilling localization (d–f) and myosin-VI localization (g–i) of the DPs. In all the illustrations we plot two stereocilia of different parameters (solid and dashed lines). In panels d and g, the number of filaments and polymerization rate are the same for two stereocilia of different heights. In panels e and h, the number of filaments is the same and the polymerization rate is 2 × 10⁻⁵ and 4 × 10⁻⁵ μm/s for the shorter and longer stereocilia, respectively. In panels f and i, the polymerization rate is the same, and the number of filaments is 800 and 2000 for the thinner and thicker stereocilia, respectively. All lengths are in microns.

