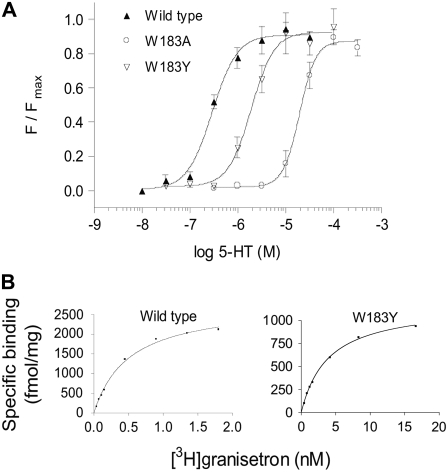
FIGURE 2.
Example data for receptor function and radioligand binding at wild-type and mutant receptors. (A) Channel function was measured using a voltage-sensitive fluorometric dye on a FlexStation. Values from a series of experiments were normalized, averaged and fitted with a four-parameter logistic equation. The calculated EC50 values are shown in Table 2. (B) Kd values were estimated using the 5-HT3 antagonist [3H]granisetron. The examples show binding for single experiments, fitted with a one site binding equation. Kd values for a series of experiments were averaged for each mutant, and are presented in Table 1.

