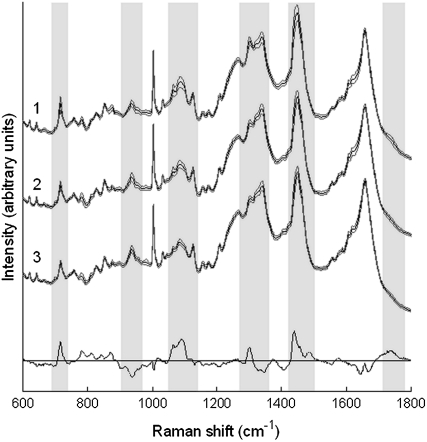
FIGURE 4.
Average Raman spectra of individual ATII cells measured at early (days 3–4, spectrum 1), middle (days 10–11, spectrum 2), and late (days 17–18, spectrum 3) time points. The spectra represent the mean of 183, 204, and 171 spectra collected from 61, 68, and 57 cells, respectively. The solid lines indicate the average spectra and the shaded lines delineate one standard deviation. Spectra have been offset for clarity. The difference spectrum (bottom spectrum) between the mean of early time point and late time point cells is also included, and has been magnified by a factor of 2.5 to highlight the main differences among cells at these time points.

