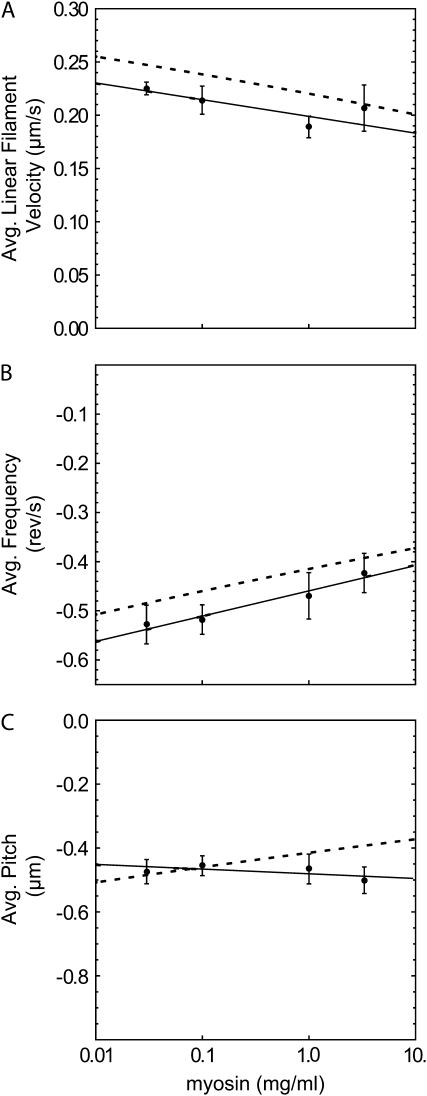
FIGURE 6.
Average values and linear fits (solid) for (A) velocity, (B) angular frequency, and (C) pitch computed at each myosin concentration (from the data in Fig. 5) with error bars determined by the bootstrap method (29). Negative values of angular frequency indicate left-handed rotation in the actin reference frame. Predictions (dashed) in each panel are calculated from the fits of the other two panels using the relation pitch = v/ω.

