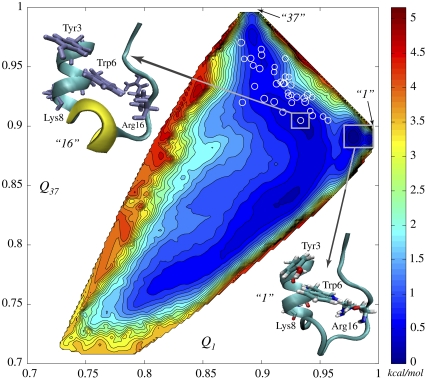
FIGURE 2.
Two-dimensional free energy surface (2D-FES) of Trp-cage native basin as a function of collective coordinates Q1 and Q37, indicating corresponding similarities to NMR models 1 and 37, was obtained using WHAM in 914 simulation windows (see Methods and Data S1). An all-atom MD simulation of 1.2 ns in duration was carried out in each window. Open circles, marking FES, represent the 38 NMR structures in the Q1 and Q37 coordinates. Spacing between contour lines is 0.22 kcal/mol (0.37 kT). White rectangles mark the deepest and the second deepest basins corresponding to model 1 (lower right corner) and model 16 (upper left corner), respectively. The difference of ∼0.6 kT in free energy is created by rotation of Tyr-3, cation-π interaction between Arg-16 and Trp-6 and disappearance of 3-10 α-helix.

