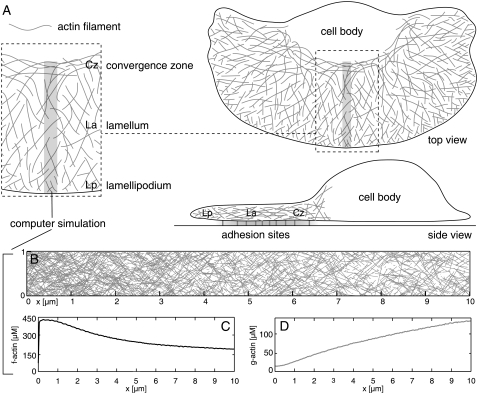
FIGURE 1.
(A) Illustration of cytoskeletal architecture within fish keratocytes. The shaded narrow rectangle specifies the scope of the computer simulation. Lp, lamellipodium; La, lamellum; Cz, convergence zone. (B) Simulated actin network based on values from Table 1. Angular variance used was 20° at ±35°. (C) F-actin concentration along the x axis (in μM). (D) G-actin concentration along the x axis (in μM).

