FIGURE 6.
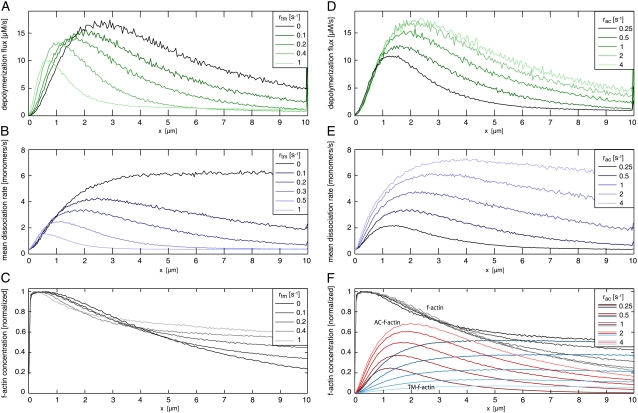
Dependence of F-actin network properties on tropomyosin binding rate rtm (left panel) and ADF/cofilin binding rate rac (right panel). (A) Depolymerization flux decreases with increasing tropomyosin binding rate. The maximum of the depolymerization flux shifts toward the leading edge from ∼3 μm without tropomyosin to ∼1 μm with a high tropomyosin binding rate. (B) Mean dissociation rate strongly depends on tropomyosin binding. Without tropomyosin the mean dissociation rate reaches a plateau after ∼3 μm, while with tropomyosin a local maximum appears, with position and height depending on tropomyosin binding rate. (C) The decline of F-actin concentration decreases upon enhanced tropomyosin binding. (D) Depolymerization flux increases with increasing ADF/cofilin binding rates rac. (E) Higher depolymerization flux is based on a strong increase of the mean dissociation rate. Increase of ADF/cofilin binding shifts the maximum off-rate away from the leading edge. (F) F-actin concentration drops due to enhanced disassembly when ADF/cofilin binding rates are increased. Spatial separation into ADF/cofilin-dominated and tropomyosin-dominated substructures is more pronounced with higher ADF/cofilin binding rates. All rates were set to the values given in Table 1 except those illustrated within the respective figures. AC, ADF/cofilin; TM, tropomyosin.

