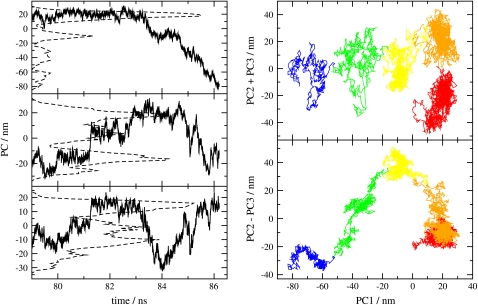
FIGURE 7.
(Left) First three PCs (top, 1; middle, 2; bottom, 3) of the entire DNA duplex as a function of time in the final stages of melting, between 79 and 86.2 ns (solid line) and their probability distributions (dashed line). (Right) Plot of PC2 + PC3 and PC2 − PC3 as a function of PC1 for the same time period. The rainbow of colors (red to blue) indicates the order of time (79–86.2 ns).

