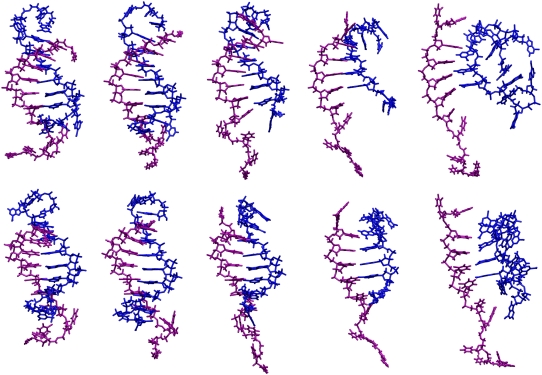
FIGURE 8.
Conformations of the DNA duplex during the melting transition at the centers of the substates shown in Fig. 7 from left to right in time order. The upper and lower rows correspond to two different views offset by 45°. The A-strand is colored blue and T-strand is colored purple. The 5′-end of the A-strand is near the bottom.

