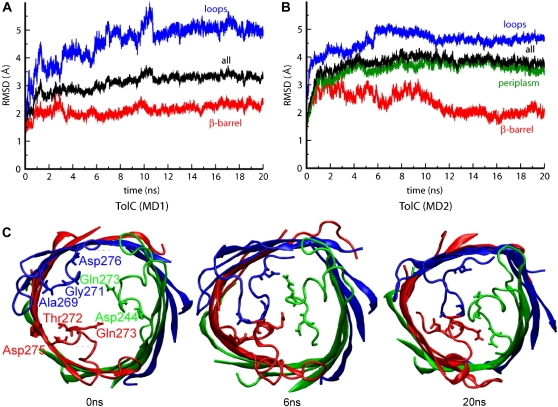
FIGURE 2.
(A and B) The RMSD of the Cα atoms from their initial coordinates as function of time, for MD1 (a) and MD2 (b). The black line shows the RMSD for all the Cα atoms; the other lines show the RMSD of the extracellular loops (blue), periplasmic region (green), and β-barrel domain (red). (C) Collapse of extracellular loops in TolC. Top view of snapshots of MD1 at t = 0 ns, t = 6 ns, and t = 20 ns, showing the closure of the pore at the extracellular region.

