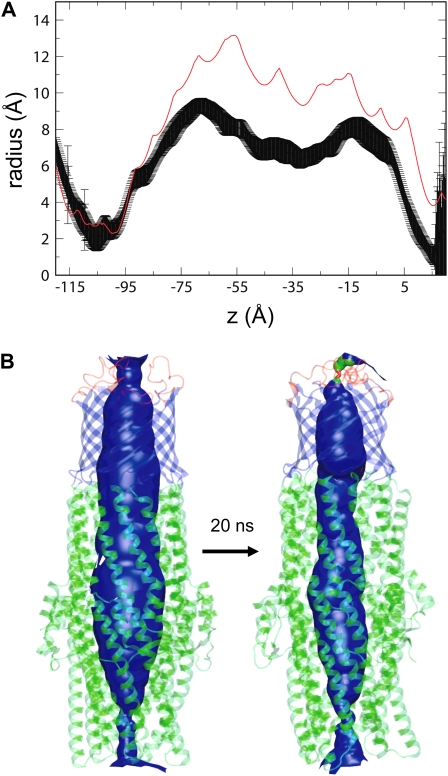
FIGURE 5.
Possible functional consequences of TolC motions. (A) Pore radius profile of TolC based on the x-ray structure (red line) compared with the average pore radius profile (± SD) derived from simulations MD2. (B) Pore lining surface for TolC simulation MD2 at the start and end of the simulation.

