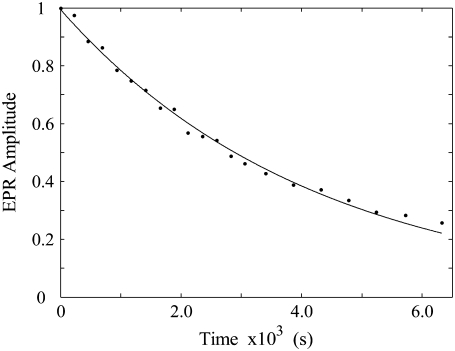
FIGURE 5.
Decay of the substrate radical EPR amplitude at 207 K after partial decay at T = 193 K. The sample was held at 193 K for 13 h, and the substrate radical amplitude decayed to 38% of the initial amplitude. The subsequent decay at T = 207 K is shown, with overlaid monoexponential fit to the data (solid line). The EPR experimental conditions are as described in the legend to Fig. 3. Simulation parameters: first-order rate constant, 2.3 × 10⁻⁴ s−1; R2 = 0.9967.

