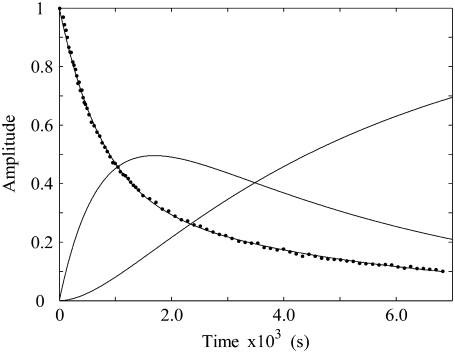
FIGURE 8.
Simulation of the CoII-substrate radical decay at 207 K by using the homogeneous linear two-step model (Scheme 2). The experimental decay data are shown as dots. The simulated normalized population of the A1 ( dotted line) state, and the calculated time dependence of the A2 (
 solid line) and A3 (
 dashed line) states, are shown. Simulation parameters: initial normalized populations A1,0 = 1.0, A2,0 = A3,0 = 0; k12 = 9.73 × 10⁻⁴ s−1, k21 = 3.87 × 10⁻⁴ s−1, k23 = 3.09 × 10⁻⁴ s−1, k32 = 0 s−1 (fixed); and R2 = 0.9994.

