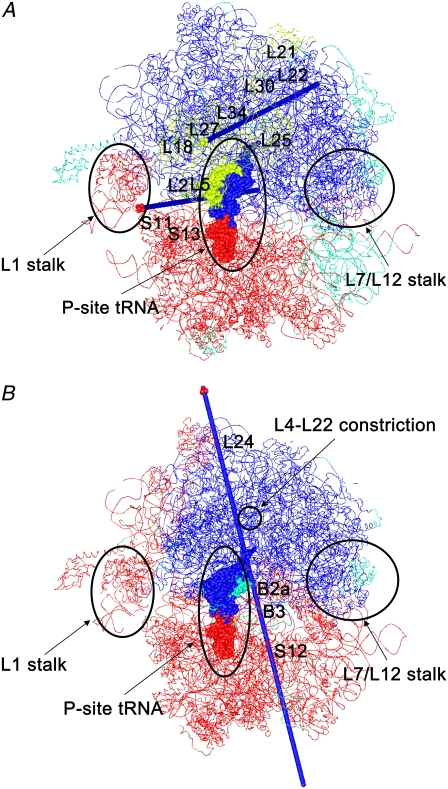
FIGURE 5.
Dynamic domains analyzed by DynDom3D. Each dynamic domain is colored. The regions that were not assigned to a dynamic domain are shown in green. tRNA at the P-site and the other molecules are depicted as space-filling and wire models. (A) The first mode in case-under: the opening and closing motion of 50S and 30S. The dynamic domains are composed of domain I (a large part of 50S including L7/L12 stalk and the body-part (the T-loop, T-stem, D-loop, and D-stem) of tRNA at the A-site and the P-site shown in blue), domain II (a large part of 30S, L1 stalk, and the anticodon stem and anticodon loop of tRNA at the A-site and the P-site shown in red), domain III (L5, L18, L21, L25, L27, L30, and 5S RNA of 50S, and nucleotides Gua15–Gua22 and Ura50–Ade64 of tRNA at the P-site shown in yellow). The axis for domains I and II is depicted as an arrow in blue with a tip in red, whereas the axis for domains I and III is depicted as an arrow in blue with a tip in yellow. (B) The first mode in case-over: ratchet-like movement of 50S and 30S. The dynamic domains are composed of domain I (a large part of 50S including L7/L12 stalk and region of the body-part of tRNA molecules at the P-site and the A-site shown in blue), domain II (a large part of 30S, L1 stalk, and the anticodon stem and anticodon loop of tRNA at the A-site and the P-site shown in red). The axis for domain I and domain II is depicted as an arrow in blue with a tip in red.

