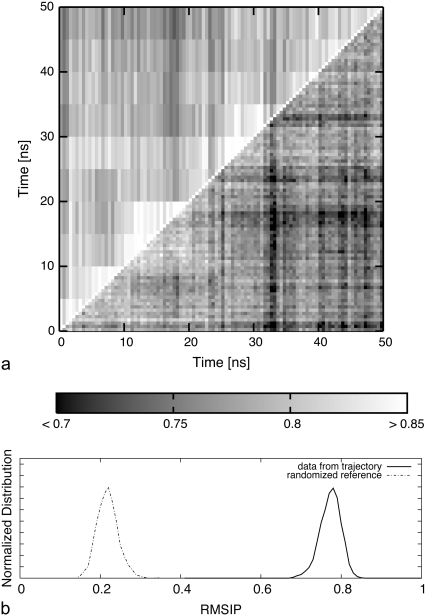
FIGURE 7.
(a) Density plot of the RMSIP between essential dynamical spaces (EDS) of 0.5-ns-long intervals of the open trajectory (time labels on the abscissas) against themselves (lower triangle), and against the EDS of 5-ns-long intervals (upper triangle). (b) The distribution of RMSIP values from the lower triangle of the matrix (pairs of 0.5-ns-long intervals) is shown with a solid curve. The dashed curve shows the distribution of RMSIP values obtained by randomizing (in a way that preserves the mobility profiles of the amino acids) the original EDS.

