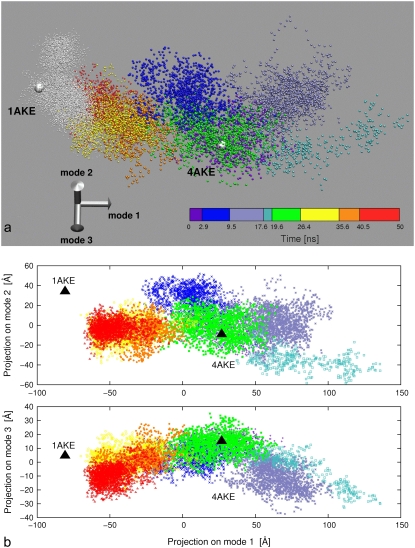
FIGURE 8.
(a) Representation of the open and closed dynamical trajectories in the space of the three lowest-energy modes of the open trajectory. Each point represents an MD configuration and its coordinates are obtained by projecting the instantaneous deformation vector from the average structure of the open trajectory onto the three modes. White points are used to represent the closed trajectory, while different colors are used to distinguish the substates of the open trajectory. The open and closed crystal structures are represented as large spheres. An animated three-dimensional view of the portrayed set of points is provided as Movie S1, Movie S2, and Movie S3. Two bidimensional projections (mode 1 versus mode 2 and mode 1 versus mode 3) of the three-dimensional scatter plot are provided in panel b.

