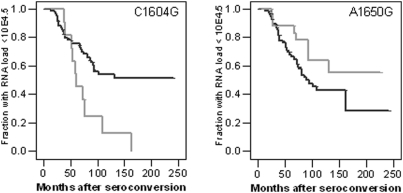
Figure 1. Survival analysis for C1604G and A1650G in DU of the ACS.
Kaplan Meier analysis for time in months from seroconversion to viral RNA load above 104.5 copies per ml plasma in DU of the ACS based on the C1604G genotype (left panel) or A1650G genotype (right panel). Black lines indicate individuals homozygous for the major allele (left panel: 1604CC; right panel: 1650AA); Gray lines indicate individuals heterozygous for the minor allele (left panel: 1604CG; right panel: 1650AG).

