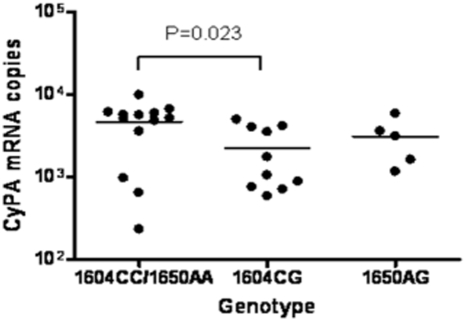
Figure 2. Analysis of CypA expression levels.
CypA mRNA levels in PBMC obtained from healthy controls that were homozygous for the 1604 and 1650 major alleles (1604CC/1650AA), heterozygous for the 1604 minor allele (1604CG), or heterozygous for the 1650 minor allele (1650AG). CypA mRNA levels were normalized for β-actin mRNA levels.

