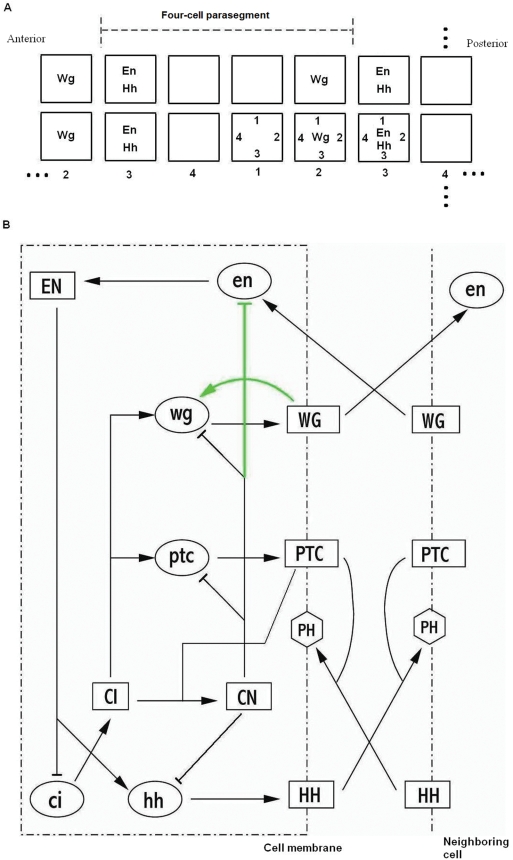
Figure 1. Expression pattern for key segment polarity genes and the interaction network.
(A) Four cells in a parasegment with periodic boundary conditions in both dimensions. Each cell is represented by a square. The convention for numbering cells and cell faces are shown. (B) Interaction network used in reference [3]. Two green lines indicate interactions added by authors to achieve the target pattern. Black lines indicate interactions based on experimental data. Shape of the nodes indicates the corresponding component: Ellipses represent mRNAs; rectangles, proteins.

