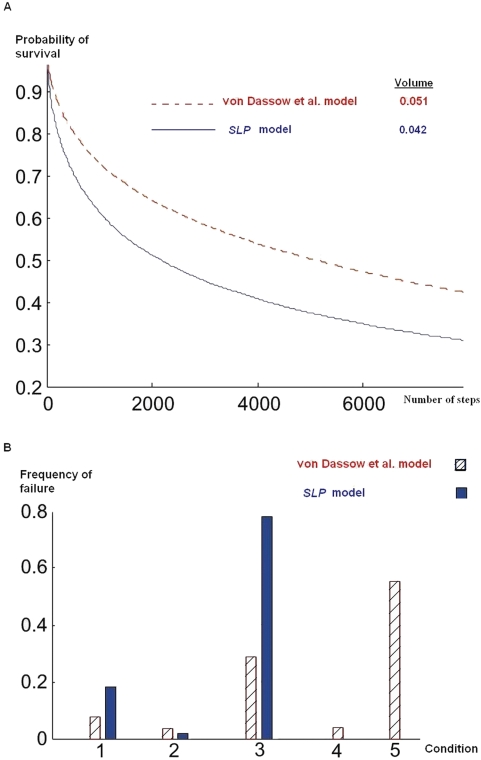
Figure 3. Random walk in the space of admissible parameters.
We choose a random point from admissible parameter set and follow a random walk until it hits a boundary after t steps. (A) The red (and dashed) and the blue (and solid) graphs represent the probability of survival as a function of time for von Dassow et al. and SLP models, respectively. These graphs results from 30,000 runs of random walks. The results given for volume are based on the fraction of feasible parameter combinations found in 1,000,000 randomly chosen combinations. (B) Histogram of violated conditions for the random walk in (A). The number above each bin indicates the corresponding condition in Tables 1 and 2.

