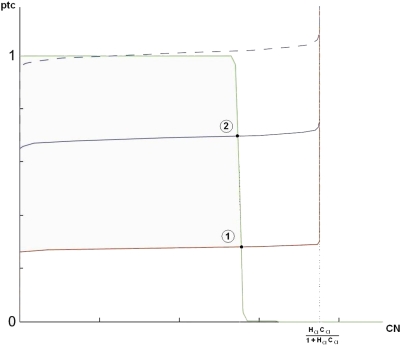
Figure 4. The nullclines for ptc and CN.
The green curve shows the ptc-nullcline. In the high Hill coefficient limit, ptc value drops sharply from one to zero as CN passes the threshold of min(1−κCIptc, κCNptc). Blue and red curves show the CN-nullclines for relatively higher and lower values of HH signaling levels, respectively. Intersection points 1 and 2 determine CI, CN and ptc in cell 1 and 2/4, respectively. Here it is assumed that the negative feedback on ptc coming from repression by CN is active. Therefore, ptc and CN are not maximally expressed. Dashed blue line shows the CN-nullcline for a fine-tuned set of parameters.

