
Figure 4.
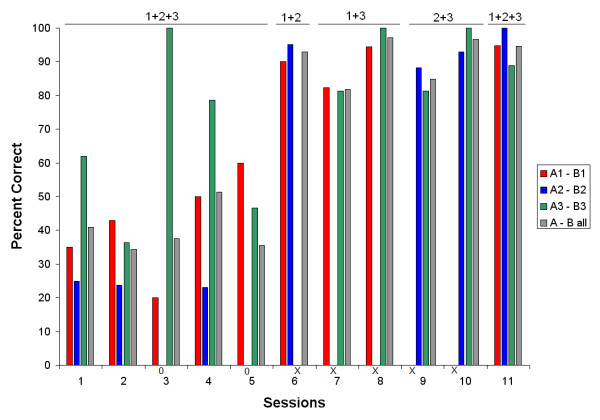
Percent correct for each of the A → B relations (1 through 3) and all three relations together. Numbers above the graph indicate which relations were presented in mixed order within a session. Along the X-axis, 0's indicate a score of zero, and x's indicate that a given relation was not presented in a session.