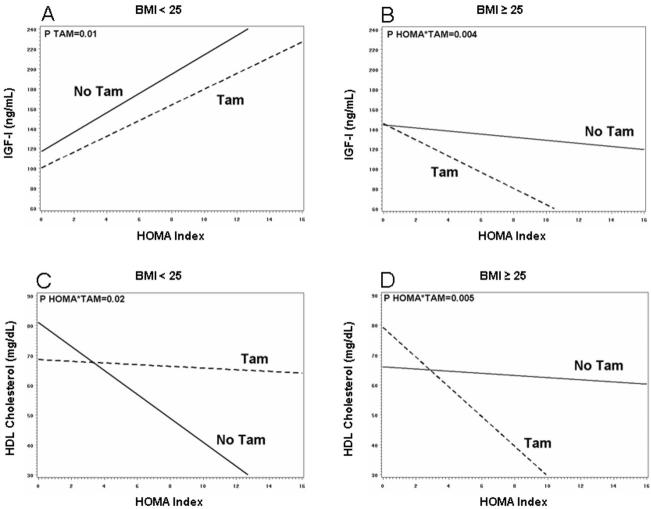
Figure 2.
Relationship between HOMA index and IGF-I (panel A and B) or HDL cholesterol (panel C and D) by BMI category according to treatment (TAM: tamoxifen+placebo or tamoxifen+fenretinide; FEN: fenretinide+placebo or fenretinide+tamoxifen). Lines represents the fitted values of the interaction between HOMA index and treatment, obtained from repeated-measure analysis of year I and II, after adjusting for baseline value, time, HOMA index and treatment. Women allocated to tamoxifen were compared with those who were not, irrespectively of combination treatment (placebo or fenretinide).

