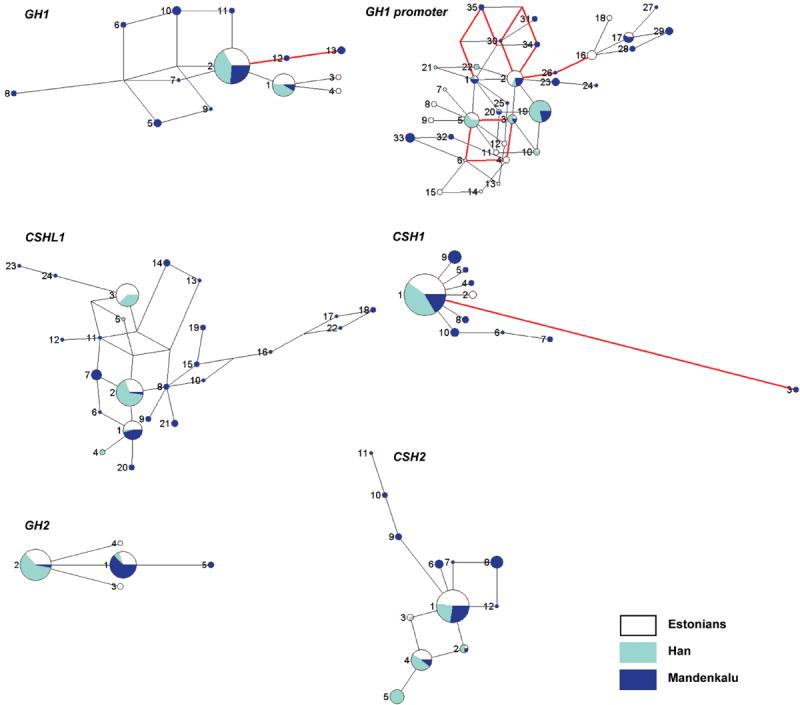
Figure 2.

Median-Joining (MJ) networks for predicted haplotypes of the hGH/CSH genes and the 5′ upstream region of GH1. Singleton polymorphisms were excluded from the analysis, because they could not be reliably phased. The size of each node is proportional to the haplotype frequency in the total dataset. The relative distribution of each haplotype among the individuals of Estonian, Chinese Han and Mandenka origin is indicated by white, light blue and dark blue, respectively. Haplotype nomenclature is shown in Supplementary Table S4A-S4F. Red lines designate identified gene conversion tracts (Table 3) – note that several haplotypes may have been formed because of gene conversion.
