
Figure 2.
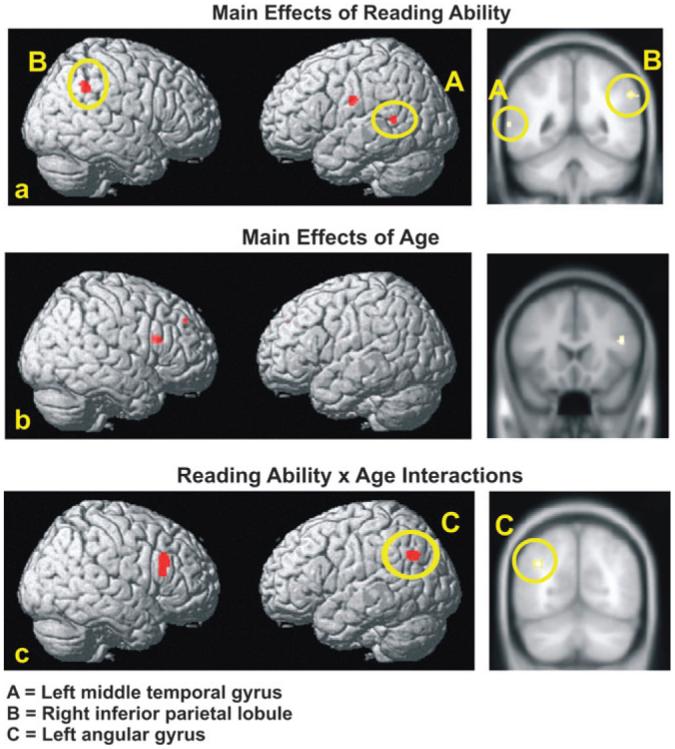
Multiple regression analyses: Main effects of reading ability, age, and age × reading ability interaction. Top row (panel a) presents surface rendering and canonical view of regions correlated with reading ability. Middle row (panel b) presents surface rendering and canonical view of regions correlated with age. Bottom row (panel c) shows surface rendering of regions and canonical view showing age × reading ability interaction. Yellow ovals encircle parietotemporal activation.