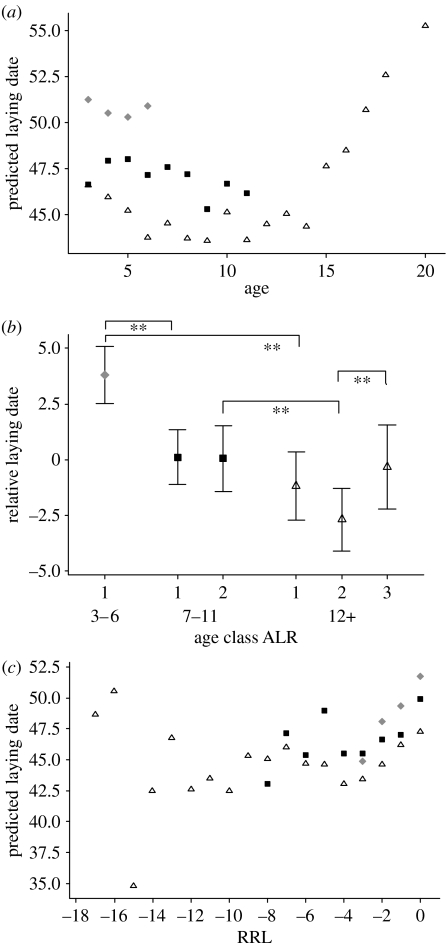
Figure 1.
(a) Fitted values for the LMM exploring age effects on laying date (model 1), illustrated with three ALR classes; 3–6 years, grey diamonds; 7–11, black squares; 12 or more, open triangles. Note that for illustrative purposes the fitted values for the continuous variable ALR are averaged across the three classes to give three curves representing ALR. Owing to different numbers of individuals in each age/ALR class, the effects of different years and the effects of individuals, the averaged points do not appear as continuous curves. (b) Mean and Bonferroni CIs for the residualized laying date for six age/ALR classes. Since there are 15 possible comparisons, the Bonferroni α-level is set to 0.05/15=0.003 for each test, and the CIs are 99.7% CIs. Standard errors are pooled standard errors, and the d.f. for the tests are 2008. In fact, only seven meaningful comparisons are considered (age classes across ALR groups (four) and age differences within age classes (three)). Horizontal bars show significant differences with an indication of the Bonferroni adjusted significance of the difference (*p<0.05, **p<0.005). Symbols are the same as given in (a). (c) Fitted values for the LMM exploring effects of RRL on laying date (model 2), illustrated with three ALR classes. Note that RRL is plotted from right to left, so that last reproduction occurs at the r.h.s. Symbols are the same as given in a.

