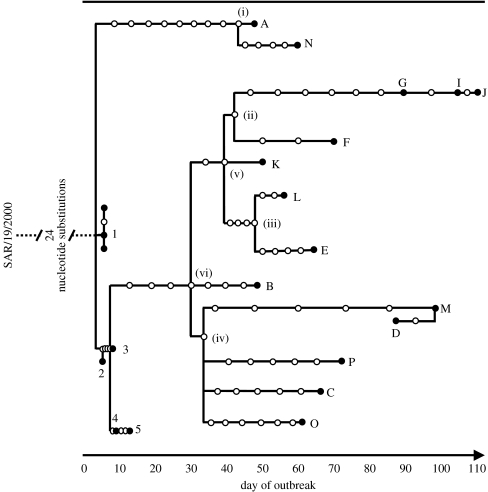
Figure 2.
Statistical parsimony analysis of 22 UK PanAsia O FMDV complete genome sequences rooted to the closest relative SAR/19/2000 by TCS; each connecting branch line represents a nucleotide substitution, with each circle representing a putative ancestral virus haplotype (filled circles indicate sequenced haplotypes). The farms infected through movement of infected livestock are represented by the numbers 1–5 (representing Defra infected premises numbers 4, 6, 7, 16 and 38, respectively), and those from a cluster in Durham are represented by the letters A–P. Day of outbreak corresponds to the number of days since 26 January 2001, the earliest plausible date since the outbreak began. In the most likely tree, it is assumed that the MRCA was present on (i) A, (ii) F, (iii) L, (iv) O, (v) K and (vi) K (and led to the transmission tree in figure 4). Assigning these MRCAs to other farms leads to less likely transmission trees.

