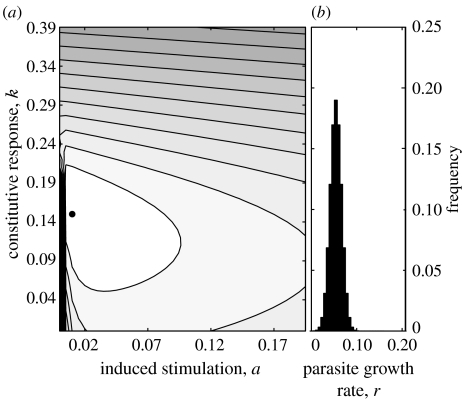
Figure 2.
(a) Plot of cost to host of investment in constitutive and induced responses when encountering parasites with varying virulence (reflected by differing growth rates, rmean=0.054). Parameter combination with minimum cost is marked by a filled circle. (b) Distribution of parasite growth rates, rmean=0.054. Parameter values are the same as given in figure legend 1.

