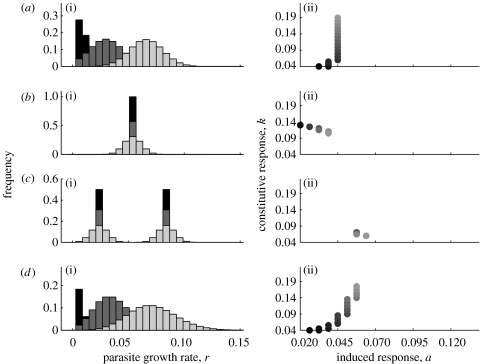
Figure 3.
The effect of changing distribution characteristics are shown for different assumptions about parasite growth rate distribution. (i) Distributions are shown, with changing distribution characteristics shading from black to light grey, for: (a) normal distribution with increasing mean and constant variance; (b) normal distribution with increasing variance and constant mean; (c) bimodal distribution, each peak has an increasing variance and constant mean; and (d) leptokurtically skewed distribution with increasing variance. (ii) The optimal combination of induced, a, and constitutive, k, parameters are shown for each distribution (a–d) with the effect of changing distribution characteristics reflected by shading from black to light grey.

