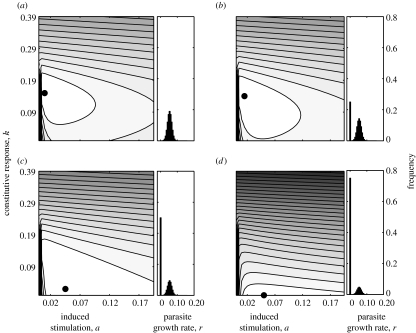
Figure 4.
Effect of parasite encounter frequency on optimal investment in immune responses with parasite growth rates normally distributed. (a–d) Optimal investment in constitutive, k, and induced, a, responses are shown for decreasing rates of parasitism, p (a, p=1.0; b, p=0.75; c, p=0.5; d, p=0.25). Rate of parasitism, p, reflects the proportion of time the host is infected by a parasite whose growth rate is greater than 0. Parameter combination with minimum cost is marked by a filled circle. Parameter values are the same as given in figure legend 1.

