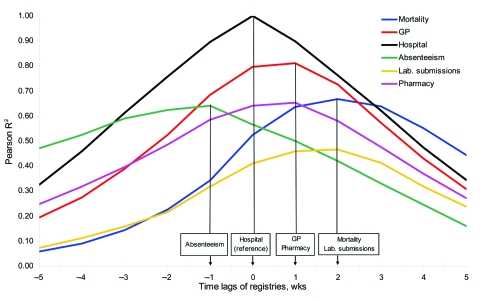
Figure 2.
The (maximum) R2 by the lagged syndromes with the hospital syndrome as a reference. Aggregated by week, univariate Pearson correlation coefficients were calculated of the hospital syndrome and each of the other syndromes. Note that the Pearson correlation coefficients are calculated over different periods for the different registries because not all registries cover the same period (Table 1). Measured by the syndrome lag with the maximized R2, the timeliness differed between the registries in the following order: absenteeism, hospital, pharmacy/general practice (GP), mortality/laboratory submissions (as projected on the x-axis).

