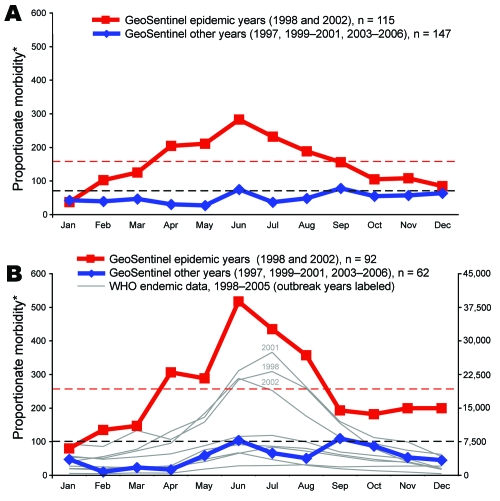
Figure 2.
Changes in dengue morbidity during regional epidemics. Heavy red and blue lines show dengue in returned travelers as a proportion of monthly morbidity in all ill returned travelers to Southeast Asia (A) and Thailand (B) during the epidemic years of 1998 and 2002 (red lines) and during all other nonepidemic years (blue lines). Black horizontal dashed lines represent mean proportionate morbidity over all months for that area during the cumulative 1997–2006 period in travelers; red horizontal dashed lines represent mean proportionate morbidity over all months during the 2 outbreak years (1998 and 2002) in travelers. Each gray line in panel B tracks month-by-month reports to the World Health Organization (WHO) of the total number of dengue cases in the endemic Thai population for a single year from 1998–2005. *Proportionate morbidity is expressed as number of dengue cases per 1,000 ill returned travelers.

