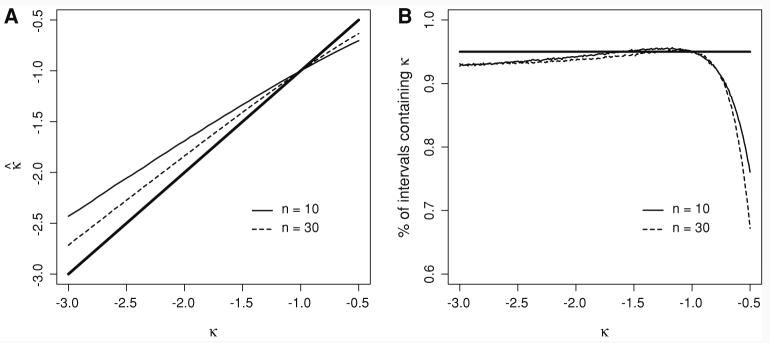
Fig. 3.
Performance of the approximate estimator for k. Each point represents the average of 100,000 simulated data sets. (a) Bias in k̂. The bold solid line gives the expectation for an unbiased estimate. For k ≠ −1, k̂ is biased toward −1. (b) Performance of 95% confidence intervals. The intervals were symmetric, with 2.5% upper and 2.5% lower tail probabilities. The bold solid line denotes a 95% probability of containing the true value of k

