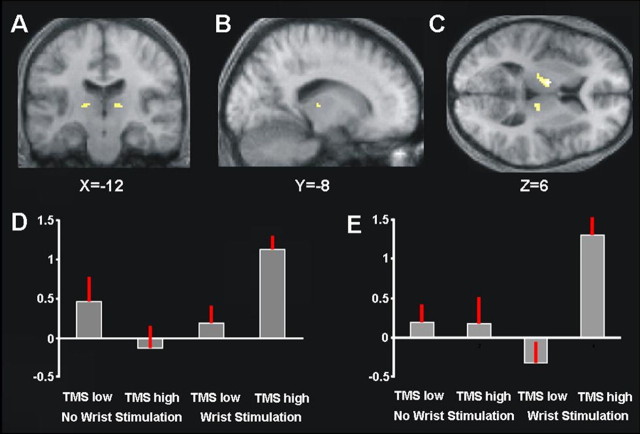
Figure 3.
VOI analysis of the thalamus, as defined by a cytoarchitechtonic postmortem atlas (see Materials and Methods). A–C, Statistical parametric maps for the interaction of TMS and median nerve stimulation within the thalamus (p < 0.05, FWE corrected for that volume of interest) overlaid onto the mean structural scan. D, E, Plots of the group mean percentage of BOLD signal change from the left (D) and right (E) thalamic clusters for each condition in the interaction of TMS intensity and right-wrist stimulation. BOLD signal in the thalamus was highest during combined right-hand somatosensory stimulation and high-intensity TMS over right parietal cortex (fourth bar in each histogram).

