
Fig. 6.
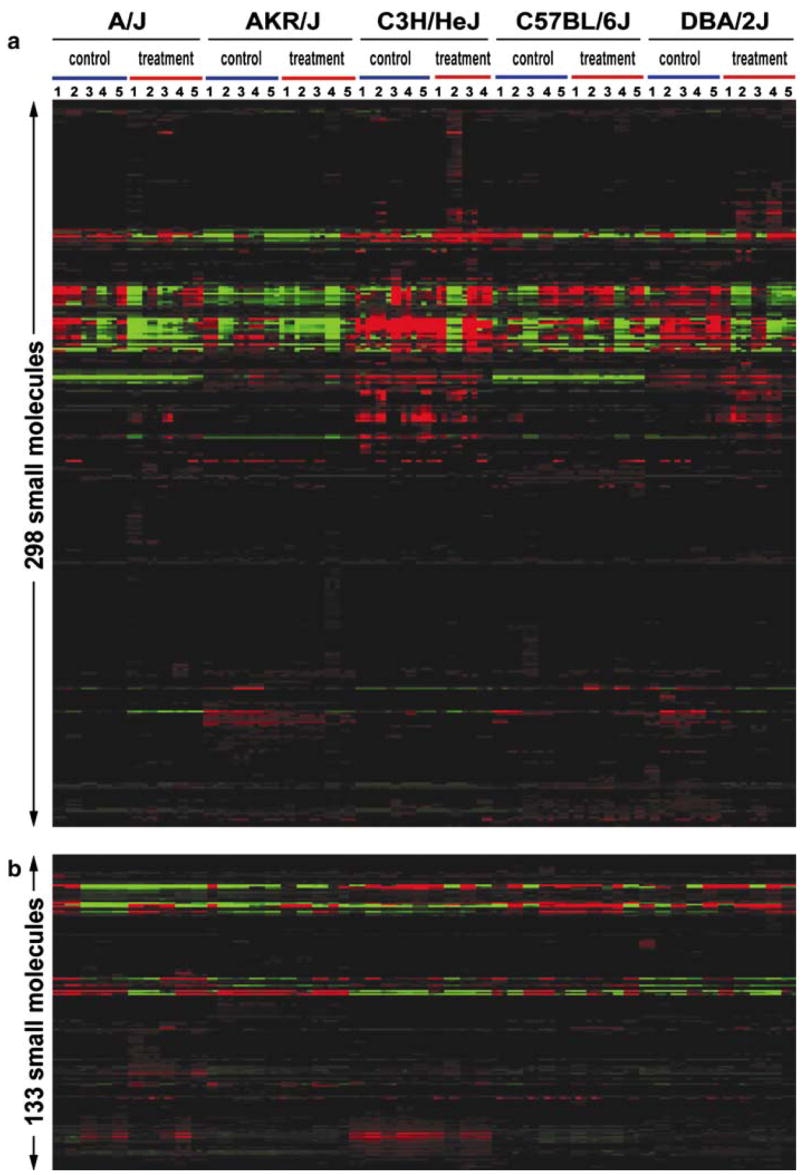
Two-dimensional metabolite features of 49 mouse serum methanol extracts analyzed by DI/FTICR-MS without prior chromatography in both (+) (a) and (−) (b) ESI modes. Blue bars represent control samples, Red bars represent treated samples. Numbers indicate individual animals (biological replicates). Three technical replicates for each biological replicate are shown. Metabolites: Red = up-regulated; Green = down-regulated; Black = median of individual relative intensities for a given metabolite across all spectra. After data processing, a total of 298 metabolites were detected in the positive ion mode across the mass range 100–900 Da, and a total of 133 metabolites were detected in the negative ion mode.