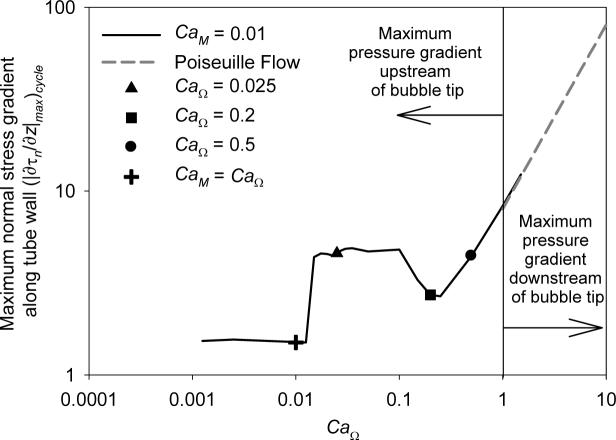
Figure 9.
Maximum magnitude of the normal stress gradient along the tube wall at any point in the cycle (|∂τn/∂z|max)cycle where A = 5 and CaM = 0.01. + indicates the onset of reverse flow (CaΩ = CaM), data to the right of this point exhibits reverse flow. Dashed line indicates the region where the maximum normal stress gradient may be predicted by (|∂τn/∂z|max)cycle = 8(CaM + CaΩ).

