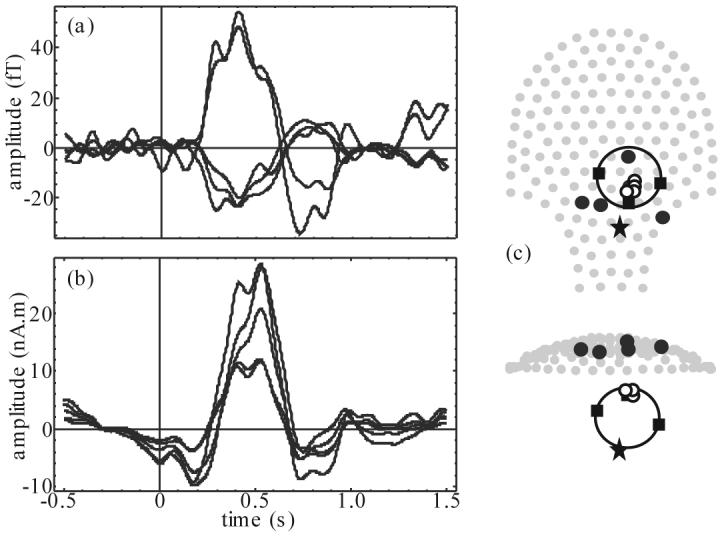
Figure 2.

Example of newborn response to flash stimulation: (a) 5 best OP processed MEG channel time courses (note the polarity reversal): Q = 8.6 – 7.1, (b) 5 best beamformer source time courses, and (c) 2 projections of sensor array (gray dots) superimposed with head localization coil position (filled squares), estimated newborn heart location (star), selected MEG channel locations plotted in (a) (black dots), and best few beamformer source locations plotted in (b) (small circles) with head model (large circle).
