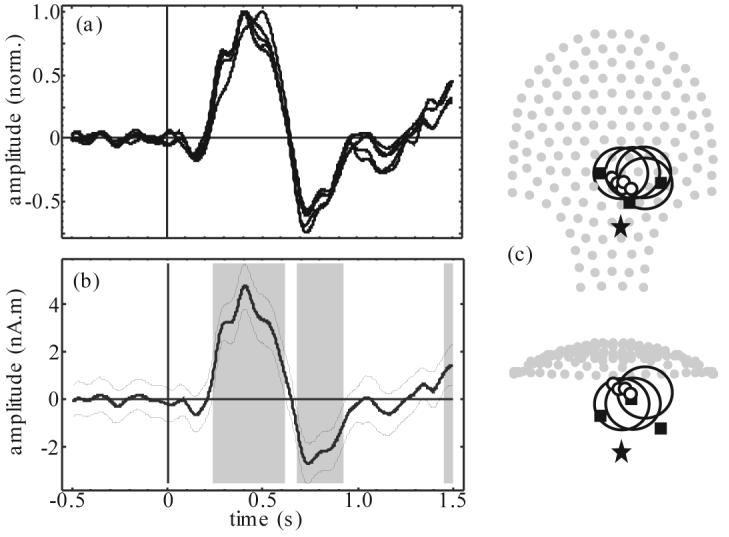
Figure 3.

Model search processing of newborn response example: (a) 5 best source time courses, normalized and polarity matched by peak value, (b) time course of the one best source (thick line) with 95% confidence interval (thin lines) and statistically significant time segments (gray bands), and (c) 2 projections of sensor array (gray dots) superimposed with head localization coil position (filled squares), estimated newborn heart location (star), and best few beamformer source locations (small circles) with associated head models (large circles).
