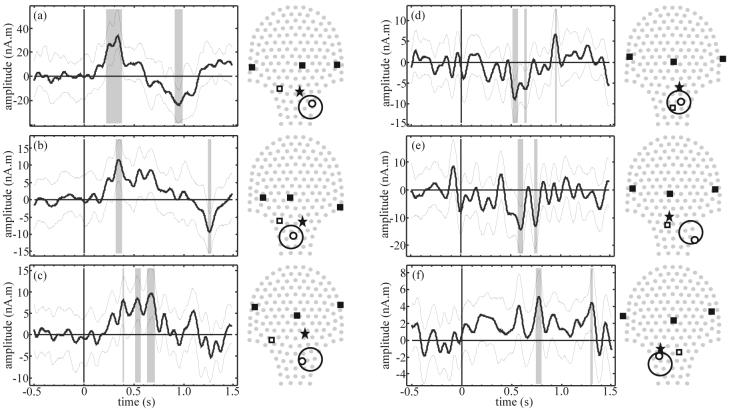
Figure 5.
Model search results from fetal response to flash stimulation for each of the best 3 SNR datasets (a – c) and poorest 3 SNR datasets (d – f). For each example, left: time course of the one best source (thick line) with 95% confidence interval (thin lines) and statistically significant time segments (gray bands); right: projection of sensor array (gray dots) superimposed with localization coil positions (filled squares), 4th coil position (open square), estimated fetal heart location (star), and best source location (small circle) with head model (large circle).

