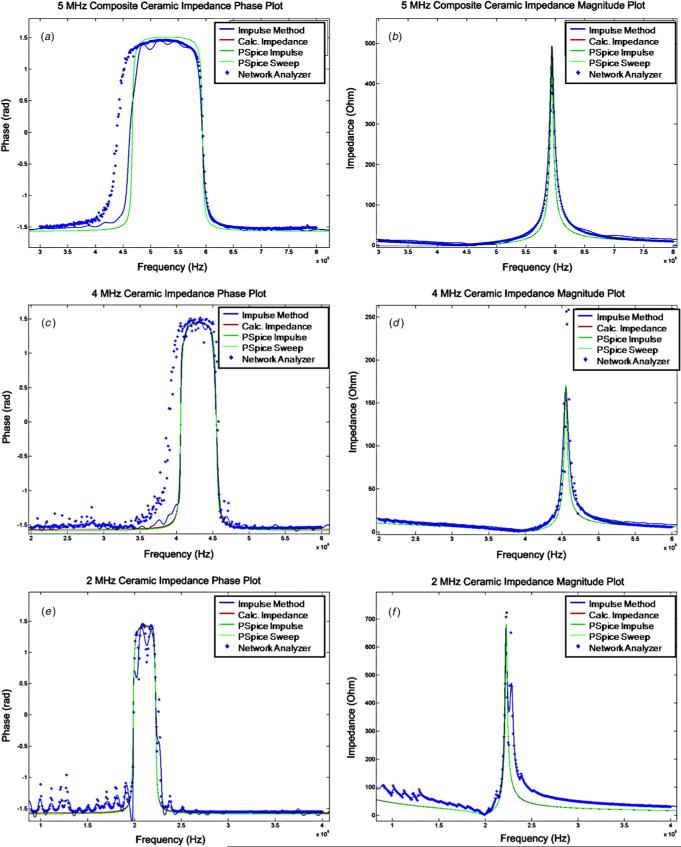
Figure 4.
Impedance phase (on left) and magnitude (on right) plots for five methods and three different piezoelectric materials. (a) and (b) 5 MHz 0.5 inch diameter composite piezoelectric impedance plots agree well overall. The phase shift of the network analyzer around resonance begins at a lower frequency compared to other methods. (c) and (d) 4 MHz 0.75 inch diameter piezoelectric impedance plots agree except for the lower frequency phase shift of the network analyzer around resonance compared with the other methods. The network analyzer shows a higher parallel resonant magnitude compared with the other methods. (e) and (f) 2 MHz 0.59 inch diameter piezoelectric impedance plots agree well. The phase and magnitude measurements of the network analyzer and impulse method have low amplitude spectral ripples through EIS plots.

