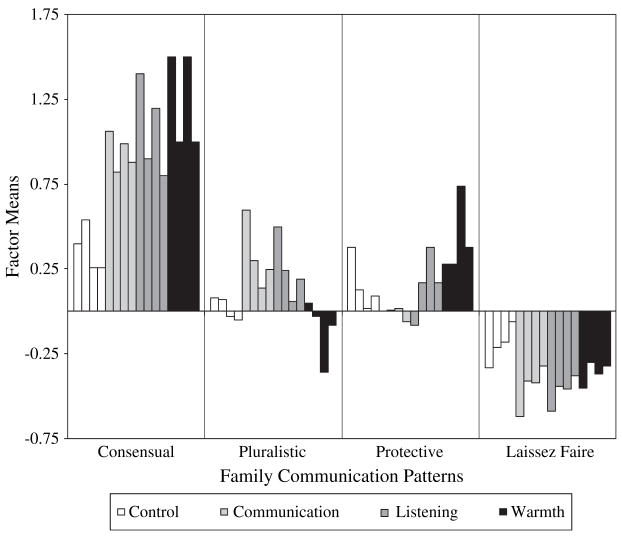
Figure 1.
Graphical Presentation of Mean Factor Scores for the First-Order Factor Indicators of the Family Communication Patterns Latent Variable.
Note: First bar in every set: mother’s mean factor score. Second bar: father’s mean factor score. Third bar: adolescent’s mean factor score. Fourth bar: sibling’s mean factor score. Bars rising above 0 represent behavior levels above the overall mean. Bars falling below 0 represent behavior levels below the overall mean.

