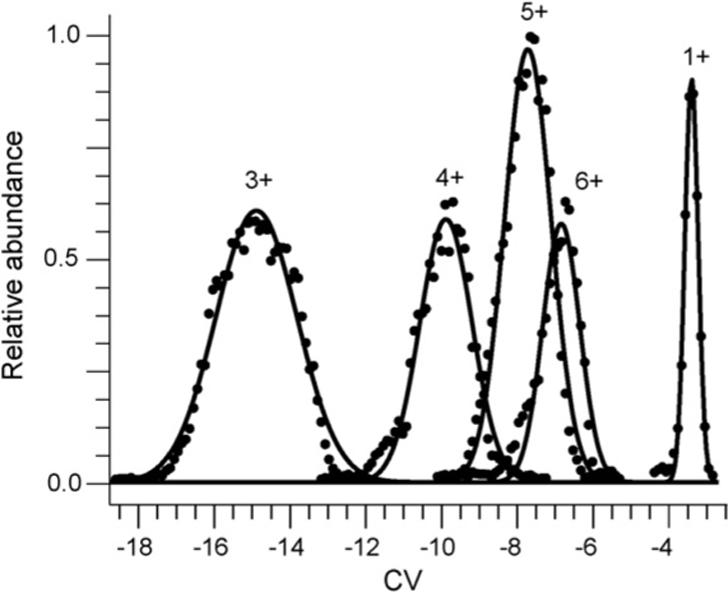
Fig. 1.

FAIMS CV scans of protonated PEG 1+ formed by ESI from a 1.0 × 10⁻⁴ M PEG 600 in 49.5/49.5/1%, by volume, water/methanol/acetic acid solution and protonated PEG 3+ through 6+ from a 1.0 × 10⁻⁴ M PEG 3400 solution in 49.5/49.5/1%, by volume, water/methanol/acetic acid. The solid lines are the best fit Gaussian distributions to the experimental data. Data for the 2+ and 7+ significantly overlap those for the 5+ and 6+, respectively, and were omitted for clarity.
